Home / Search evaluation / Search Analytics: Click-Through, Zero Results and A/B Tests
ExplainerSearch Analytics: Click-Through, Zero Results and A/B Tests
Online search metrics are measurements taken from real users of a live search system, such as click-through rate, zero-result rate, reformulation rate and abandonment, which show whether search actually helps people find things. They complement offline metrics such as nDCG and recall, which score rankings against a fixed test set. Search analytics collects these signals per query, so teams can see which queries fail and why. A/B tests then compare a change, such as a new embedding model, hybrid weighting or reranker, against the current system on live traffic. Interleaving is a more sensitive alternative that mixes results from two rankers in one list. Clicks are biased by position, so online metrics need careful reading. The vector database records latency and errors, but clicks and outcomes must be logged by the application.
Online search metrics in four facts
- Offline metrics use labelled test sets; online metrics use the behaviour of real users on live search.
- Zero-result rate and reformulation rate point to failing queries without any relevance labels.
- At a 30 percent click-through baseline, detecting a 1-point change needs about 33,600 users per arm.
- Interleaving compares two rankers inside one result list and needs far less traffic than a standard A/B test.
What are online search metrics?
Online search metrics are numbers computed from how real users interact with a live search system, from the queries they type to what they click and whether they succeed. They measure search in use rather than search on a test set.
Offline evaluation asks whether the right documents rank highly for a set of judged queries, using measures such as precision at k, recall at k and nDCG. It is repeatable and cheap, but it only covers the queries someone judged. Online metrics cover every query real users send, including the odd, misspelled and brand-new ones that no test set anticipated.
The two kinds answer different questions. Offline metrics say whether a change should help; online metrics say whether it did. Most teams use offline evaluation to screen changes and online measurement to confirm them, as set out in how to evaluate semantic search. Information retrieval metrics covers the offline family in full.
Where do online search metrics come from?
Online search metrics come from logging each step of a search session: the query, the results shown, the clicks and the final outcome. Each step yields its own signals.
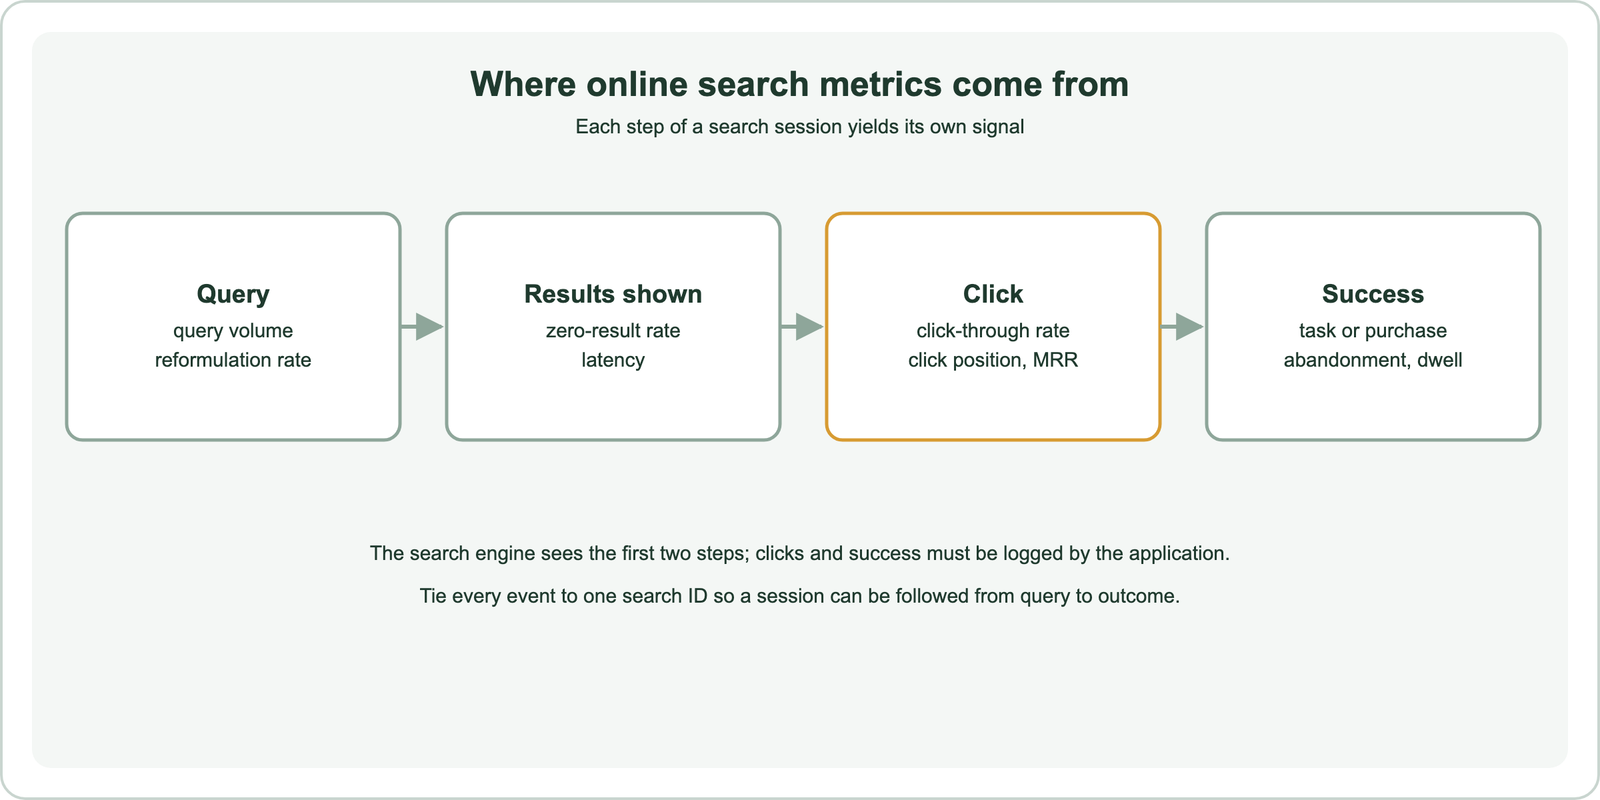
The search engine itself sees only the query and the results. A vector database such as Weaviate exposes Prometheus metrics for query latency, request counts and errors, and can log slow queries. It does not see what the user clicked. Clicks, dwell time and purchases happen in the application, so the application must log them.
The key design choice is a search ID. Give each search a unique ID, log it with the query and the ranked result IDs, and attach it to every later click and conversion. Without it, a click cannot be tied back to the ranking that produced it, and most metrics become guesses. Log the model, index and configuration version too, so results can be split by variant.
Which online search metrics are the most useful?
The most useful online search metrics are click-through rate, zero-result rate, reformulation rate, abandonment rate and a success measure tied to the product, such as purchases or resolved tickets. Latency belongs on the list too.
Click-through rate is the share of searches with at least one click. Mean reciprocal rank of the first click rewards clicks near the top; mean reciprocal rank explains the calculation. Zero-result rate is the share of searches that return nothing, a direct sign of missing content or vocabulary. Reformulation rate is the share of searches quickly followed by a reworded query, a sign the first results missed.
Abandonment is a search with no click and no further action, though it can mean success when the answer appeared in a snippet. Success metrics, such as add-to-cart, a resolved support ticket or time to the first useful click, connect search to the business. Track percentile latency as well, since slow search lowers engagement whatever the ranking quality.
How do online metrics change with semantic search?
Online metrics change with semantic search because vector search almost never returns zero results, so the zero-result rate stops being a reliable failure signal. Other signals have to take its place.
Keyword search returns nothing when no document shares the query’s words. Vector search always returns the nearest neighbours, however distant, so a query with no good answer still gets a full page of weak results. The failure moves from “no results” to “irrelevant results”, which only clicks, reformulations and abandonment reveal. Why vector search returns irrelevant results covers the causes.
Two practical fixes help. Log the top similarity score with each search, and track the share of queries whose best score falls under a threshold tuned for your model; that becomes a “low-confidence” rate. In hybrid search, log whether the keyword side returned anything, since a query with zero keyword hits but many vector hits is worth reviewing. For RAG, add answer-level signals such as thumbs up or down, and whether the user asked again.
Why are clicks a biased signal of relevance?
Clicks are a biased signal of relevance because users click top results more often regardless of quality, and they can only click what they were shown. Raw click counts favour whatever already ranks first.
Joachims and colleagues showed with eye-tracking studies in 2005 that users trust the order of results, so a document gets more clicks at rank 1 than it would at rank 5. This position bias means a ranker can look good simply because its output fills the top slots. Presentation bias adds to it: a result with an attractive title or image draws clicks it may not deserve.
Several methods correct for this. Comparing two rankers on the same traffic cancels much of the bias, because both face the same users. Interleaving goes further by placing both rankers’ results in one list. Click models and counterfactual methods estimate position effects and reweight clicks, a large research area. For most teams, controlled comparisons are the practical answer, measured against relevance and recall offline.
How do you A/B test a change to search?
You A/B test a change to search by randomly splitting users between the current system and the changed one, then comparing a chosen metric after enough traffic. The split must be by user, not by query.
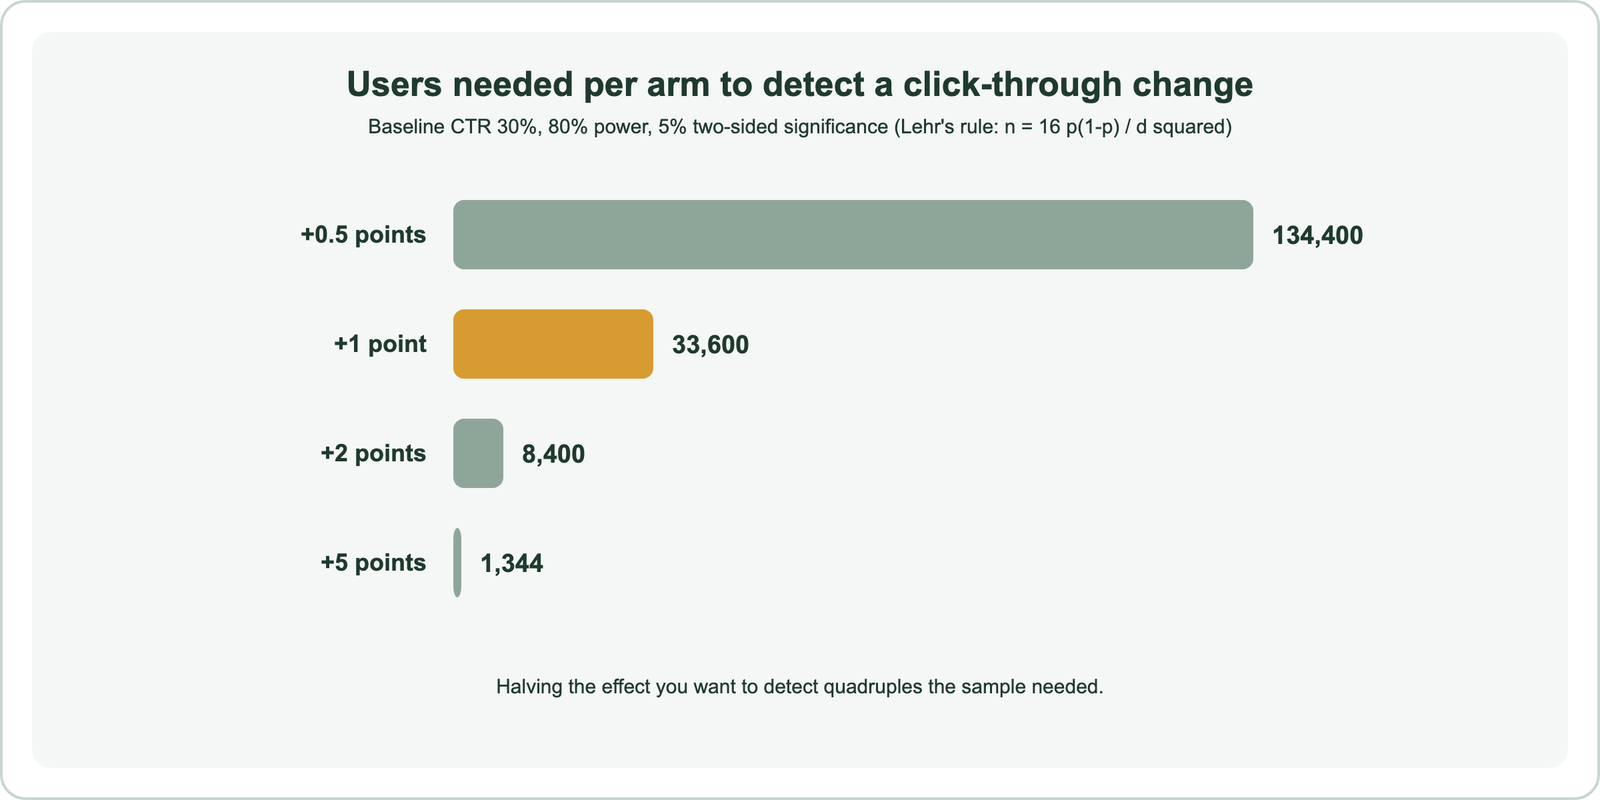
Pick one primary metric before starting, such as click-through rate or success rate, and fix the run length in advance. Randomise by user so one person sees a consistent system. Lehr’s rule gives a quick estimate of the users needed per arm: 16 times p times (1 minus p), divided by the squared difference to detect. At a 30 percent baseline, a 1-point change needs about 33,600 users per arm, while a 5-point change needs about 1,344.
Stopping as soon as a result looks significant inflates false positives, so run to the planned size. Watch guardrail metrics such as latency and zero-result rate alongside the primary one. Changes worth testing this way include a new embedding model, a different hybrid weight, a reranker, or query rewriting. The same method tests prompts in a RAG system, with answer feedback as the metric.
When is interleaving better than an A/B test?
Interleaving is better than an A/B test when traffic is limited and the question is simply which of two rankers users prefer. It mixes both rankers’ results into one list and counts which ranker’s results get clicked.
In team-draft interleaving, described by Radlinski, Kurup and Joachims in 2008, the two rankers take turns picking their next-best result for the shared list, and each click credits the ranker that contributed it. Every user sees both systems at once, so differences between users cancel out. Chapelle and colleagues later reported that interleaving detected differences with far less traffic than comparing absolute metrics between A/B groups.
Interleaving answers a preference question, not a business one. It shows which ranker users favour, but not by how much revenue or engagement would change. Use it to screen many ranking variants, then confirm the winner with an A/B test on the metric that matters.
How does search analytics find failing queries?
Search analytics finds failing queries by grouping logged searches and ranking the groups by volume and failure signals, such as no clicks, quick reformulation or low top scores. A handful of query groups usually account for much of the pain.
Start with the top queries by volume and check their click-through rate, then the queries with the most reformulations. Group variants of the same intent, since “cancel account”, “close my account” and “delete subscription” are one problem. Embedding the logged queries and clustering them groups intents automatically, and a language model can name each cluster. This is what an “AI search behaviour analysis” tool does with query logs.
Each failing group points to a fix: missing content, a synonym or query rewrite, a chunking problem, or a ranking change. Turn the failing queries into labelled test cases, which feeds search test sets and relevance judgments, so offline evaluation covers them from then on. Ongoing tracking of all of this is covered in monitoring search quality in production.
How do online metrics connect to offline benchmarks?
Online metrics connect to offline benchmarks by validating them: a change that wins offline should also win online, and when it does not, the test set or the benchmark misses something users care about. Each corrects the other.
Public retrieval benchmarks measure models on someone else’s data. Your own test set measures them on your data. Online metrics measure them on your users. A gap between offline gains and online results often means the test set over-represents easy queries, or that latency or presentation changed alongside the ranking.
Index settings also show up online. An approximate index tuned too aggressively loses some true neighbours, which ANN recall measures offline and which may appear online as a small drop in clicks. Keep a short checklist per release: offline scores, ANN recall, latency percentiles and a controlled online comparison.
Online search metrics measure search through real user behaviour: click-through rate, zero-result rate, reformulation, abandonment, success and latency. The application must log clicks and outcomes with a search ID, since the search engine only sees queries and results. In semantic search, low top scores and reformulations replace zero results as the main failure signals. Clicks are position-biased, so compare variants with controlled A/B tests sized in advance, or with interleaving when traffic is short. Use search analytics to find failing query groups and turn them into test cases for offline evaluation.