Home / Search evaluation / Monitoring Semantic Search Quality in Production
ExplainerMonitoring Semantic Search Quality in Production
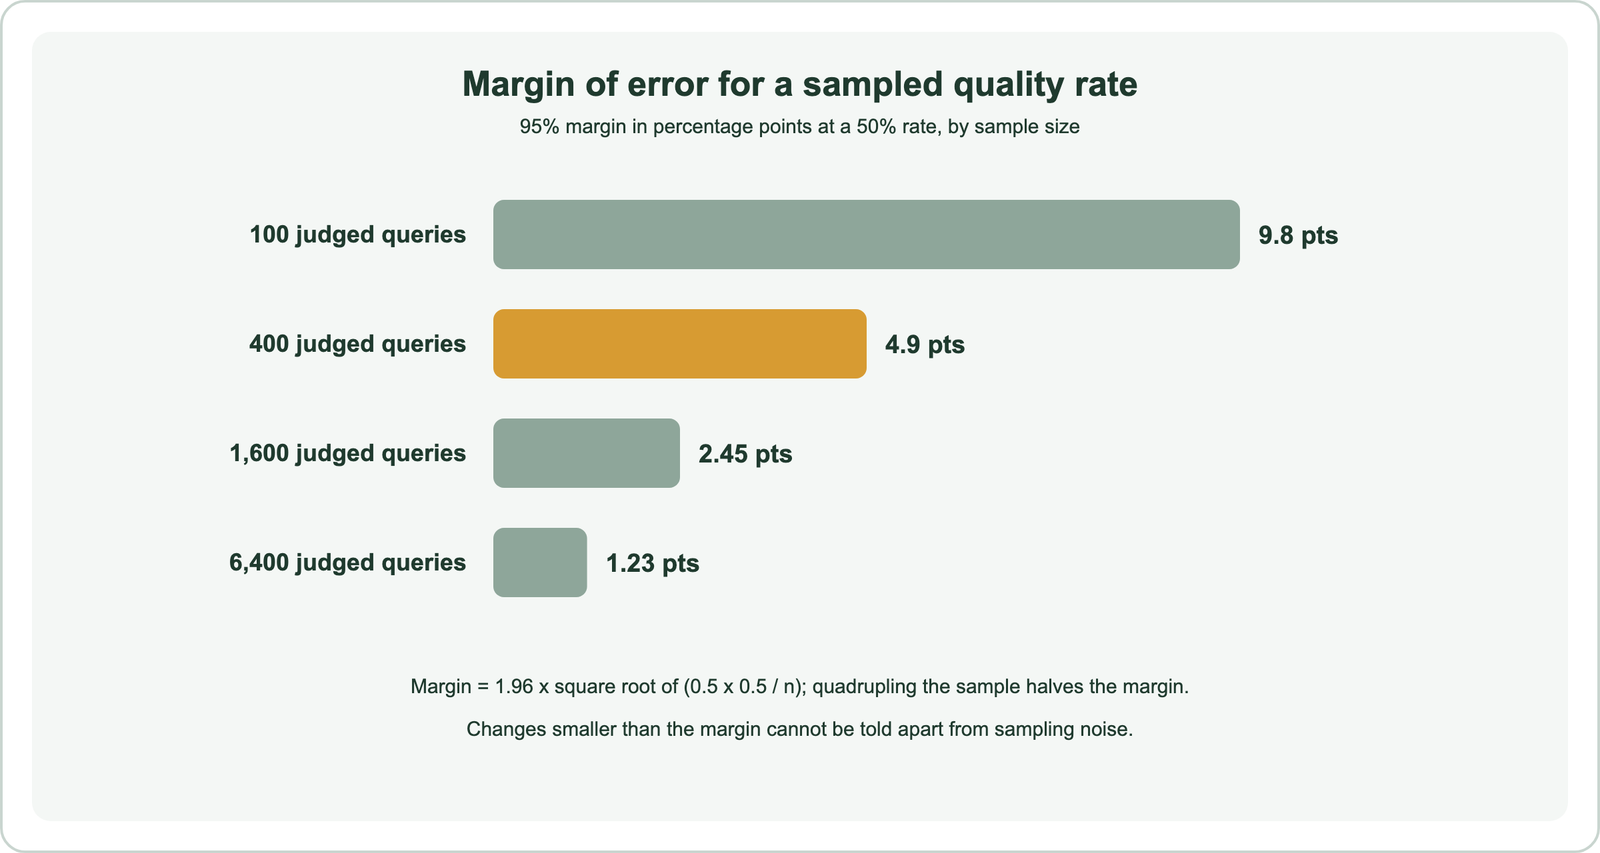
Monitoring semantic search quality in production means tracking signals at four layers, system health, retrieval behaviour, index freshness and judged relevance, and alerting when any of them moves outside its own normal range. System metrics such as latency and errors are cheap and continuous but say nothing about relevance. Retrieval signals such as the zero-result rate, the distribution of top similarity scores and a sampled ANN recall check catch many silent failures. Freshness signals show whether new and updated content is searchable. Judged quality comes from regularly sampling real queries and rating results, by people or an LLM judge. Alert thresholds should come from each metric’s own history, not from generic numbers. Sample size limits what you can detect: with 400 judged queries, a 50 percent rate carries a 95 percent margin of about 4.9 points.
Monitoring search quality in four facts
- Latency and error dashboards cannot show relevance; quality needs its own signals.
- Silent failures, such as a broken embedding call or a stale index, often leave latency unchanged.
- Weaviate exposes Prometheus metrics and can filter objects by creation or update time for freshness checks.
- Quadrupling the number of judged queries halves the margin of error of a sampled quality rate.
What does monitoring search quality in production involve?
Monitoring search quality in production involves logging every query and its results, computing signals that track relevance and freshness, and checking them continuously against their normal ranges. It continues the offline evaluation done before launch.
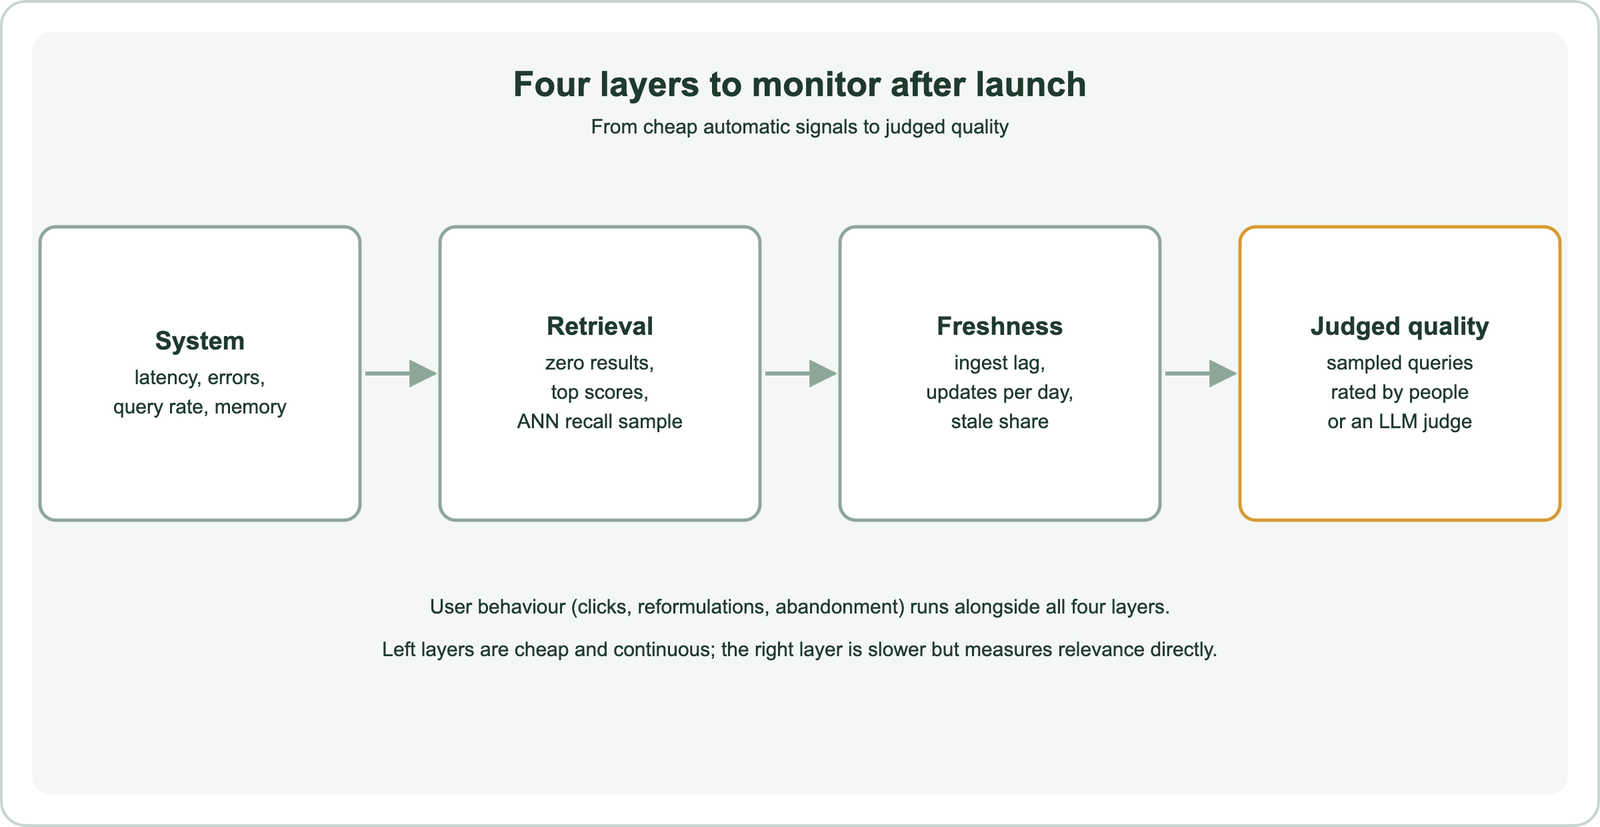
Offline evaluation, described in how to evaluate semantic search, tests a fixed set of queries before a change ships. Production is different. Real queries shift, content changes daily, and components such as embedding services fail in ways a test set never sees. Monitoring watches the live system for those changes.
The foundation is logging. For each query, record the query text, any filters, the result identifiers and scores, latency, and later the user’s clicks. Without that log, no quality question can be answered after the fact. Mind privacy rules when logging query text, and keep retention limited.
Which system metrics should you track?
Track query latency percentiles, error rates, query volume, indexing throughput and memory use, because these show whether the search service is healthy and fast. They are necessary but not sufficient for quality.
Weaviate exposes Prometheus-compatible metrics when PROMETHEUS_MONITORING_ENABLED is set, on port 2112 by default, according to its documentation. Its metrics cover query and batch durations, object operations and memory, and its example repository includes Grafana dashboards. Embedding API calls should be monitored as well, since a slow or failing vectorizer stalls both imports and queries.
Watch the high percentiles, such as the 95th and 99th, not only the average, as explained in search latency. A system can be fast and healthy while returning poor results, so pair these metrics with retrieval signals.
Which retrieval signals can reveal quality problems?
The zero-result rate, the distribution of top similarity scores, the share of queries falling back to keyword-only matches and a sampled ANN recall check reveal many quality problems without any human labels. Each is cheap to compute from the query log.
A rising zero-result rate often means a filter bug, a tenant with an empty index or a broken keyword analyzer. A sudden shift in the top similarity score distribution can mean the query embedding model changed, or that queries and documents are now embedded by different models. That mismatch is a classic silent failure: latency stays normal while results become random. Note that pure vector search almost never returns zero results, so track low top scores too.
ANN recall can drift as an index grows or settings change. Periodically take a sample of real queries, run exact brute-force search over the same vectors offline, and compare the overlap with the live results, as covered in ANN recall. When results look irrelevant despite healthy signals, the diagnosis steps in why vector search returns irrelevant results apply.
How do you monitor index freshness?
You monitor index freshness by measuring the delay between a source change and its appearance in search results, and by tracking how much of the index was updated recently. Stale content is a quality failure even when ranking is perfect.
from datetime import datetime, timedelta, timezone
from weaviate.classes.query import Filter

# requires inverted_index_config=Configure.inverted_index(index_timestamps=True)
docs = client.collections.use("Doc")
since = datetime.now(timezone.utc) - timedelta(hours=24)
updated = docs.aggregate.over_all(
    filters=Filter.by_update_time().greater_than(since), total_count=True
).total_count
Weaviate can index each object’s creation and last update times when timestamp indexing is enabled, so a scheduled job can count recent updates and compare them with the source system’s change count. A gap means the ingestion pipeline is falling behind or failing. For end-to-end lag, write a canary document with a unique phrase on a schedule and measure how long it takes to become findable.
Agents and RAG systems that answer from search results need this most. A production AI agent can cite outdated prices or policies without any visible error. Store a source modification date on each object, return it with results, and alert when the share of results older than your freshness target grows. Re-embedding after model changes is a separate freshness event, covered in re-embedding when the model changes.
How do user behaviour signals indicate quality?
User behaviour signals indicate quality through clicks, reformulations, abandonment and downstream actions, which reflect whether people found what they needed. They are noisy and biased, so read trends rather than single values.
A rising reformulation rate, where users immediately rephrase a query, suggests the first results missed. Queries with no click, or a click followed by a quick return, point to poor results. Clicks are biased by position, since top results get clicked more whatever their quality. The metrics and their pitfalls are covered in online search metrics and analytics.
For RAG and agent applications, behaviour signals shift to answer feedback, follow-up questions and escalations to people. These systems often show no result list at all. Log which retrieved passages fed each answer, so a bad answer can be traced to retrieval or to generation.
How do you measure judged quality in production?
You measure judged quality in production by sampling real queries on a schedule, rating their top results for relevance, and computing metrics such as precision at k or nDCG on the sample. This is the only layer that measures relevance directly.
Raters can be people or an LLM used as a judge with a clear rubric. LLM judges scale cheaply but must be checked against human ratings on a subset, because they can be biased or inconsistent. Keep the rubric and judge model fixed across periods, or a change in the judge will look like a change in quality. Judgment methods are covered in search test sets and relevance judgments.
Sample size sets what a judged sample can detect. For a rate near 50 percent, the 95 percent margin is 1.96 times the square root of 0.25 divided by the sample size. That gives about 9.8 points at 100 queries and 4.9 at 400. A drop from 72 to 69 percent cannot be confirmed with 100 judged queries. Choose sample sizes for the smallest change that matters, and stratify by query type so rare but important segments are covered.
How do you detect query and content drift?
You detect drift by comparing the current distribution of queries and content with a reference period, using both simple statistics and embeddings. Drift does not always lower quality, but it signals that offline tests may no longer represent reality.
For queries, track the share of new terms not seen in the reference period, query length and the mix of query types. In embedding space, compare the average query vector or cluster proportions with the reference; a large shift means users are asking about new things. New topics often arrive with new products, seasons or events.
For content, track how many documents are added and removed per day by section, and whether new content falls into regions with few existing neighbours. When drift appears, refresh the offline test set with recent real queries and rerun evaluation. If a domain shift is large, the guidance in domain-specific embeddings applies.
How should you set alert thresholds?
Set alert thresholds from each metric’s own history: compute its normal range over recent weeks, accounting for daily and weekly cycles, and alert when it leaves that range. Generic thresholds copied from elsewhere rarely fit a specific system.
A common method is a control band: the mean plus or minus a multiple of the standard deviation over a rolling window, computed separately per hour of week if traffic is cyclical. Wider bands mean fewer false alarms but slower detection. Hard limits still make sense for things that should never happen, such as an embedding service error rate above zero for several minutes, or zero objects updated in a day when the source changes daily.
Route alerts by layer. System alerts go to the on-call engineer. Retrieval and freshness alerts go to the team that owns the pipeline. Judged-quality changes go into a weekly review, since they need investigation rather than an immediate page. Tie every alert to a runbook entry that says what to check first.
How do you monitor retrieval quality in RAG and agent systems?
You monitor retrieval quality in RAG and agent systems by logging each retrieval call with its query, results and scores, and evaluating retrieval separately from the generated answer. Otherwise a retrieval regression is hidden inside answer quality.
For each answer, record which passages were retrieved and which were cited. Measure context relevance, the share of retrieved passages that are relevant, and answer groundedness, whether the answer is supported by them. LLM judges are commonly used for both, again checked against human labels. Agent frameworks that issue several searches per task need these logs per call, as discussed in agentic retrieval and agentic search.
Track freshness of cited sources too, as an agent answering from a stale page fails silently. Offline metrics such as recall at k, precision at k, nDCG and mean reciprocal rank apply to the sampled retrieval calls. The broader family is in information retrieval metrics, and the trade-off between them in relevance vs recall.
How does monitoring feed back into improvement?
Monitoring feeds back into improvement by turning failures it finds into test cases, so every production problem strengthens offline evaluation for the next change. The loop keeps the test set representative.
Add queries with zero results, low judged relevance or heavy reformulation to the test set, with corrected judgments. Before any model, index or ranking change, run the updated set and compare with the current system. Public retrieval benchmarks help choose candidates, but your production-derived set decides.
After a change ships, watch the monitoring layers closely for the first days, and keep the old configuration ready to restore. In Weaviate, named vectors and collection aliases make it possible to run old and new setups side by side and switch back quickly if quality drops.
Monitoring semantic search in production covers four layers: system health, retrieval signals, index freshness and judged relevance, with user behaviour alongside. Latency and errors cannot show relevance, so add zero-result rates, score distributions, ANN recall samples and freshness checks, which Weaviate supports through Prometheus metrics and timestamp filters. Judge sampled queries regularly, choosing sample sizes for the change that matters: 400 queries give about a 4.9-point margin at 50 percent. Set alert thresholds from each metric’s own history. In RAG and agent systems, log and evaluate retrieval separately from answers, and feed every failure back into the test set.