Home / Search evaluation / Information Retrieval Metrics: Which to Use and When
Information Retrieval Metrics: Which to Use and When
Information retrieval metrics are scores that measure how well a search system ranks relevant documents for a set of test queries, usually on a 0 to 1 scale where higher is better. Each metric answers a different question. Precision at k asks how much of the top k is relevant, and recall at k asks how much of everything relevant was found. MRR asks how high the first good result sits, MAP rewards every relevant hit by position, and nDCG weighs graded relevance by rank. All of them need a test set: queries plus judgments of which documents are relevant. The right metric follows from how results are used. RAG pipelines care most about recall in the few passages a prompt holds, question answering about the first hit, and ranked result pages about nDCG. Offline metrics are complemented by online signals such as clicks and abandonment.
Information retrieval metrics in four facts
- Precision and recall ignore the order of results, while MRR, MAP and nDCG reward relevant results that appear earlier.
- nDCG is the only one of the common metrics that uses graded relevance, such as highly relevant versus somewhat relevant.
- Weaviate notes that nDCG@k is the default metric of the MTEB leaderboard’s retrieval category.
- ANN recall measures agreement with exact nearest neighbour search, which is different from recall of relevant documents.
What are information retrieval metrics?
Information retrieval metrics are formulas that compare a system’s ranked results with known relevance judgments and turn the comparison into a number. They make search quality measurable, so two systems or two settings can be compared on the same queries.
Every metric needs the same three inputs. The first is a set of test queries. The second is relevance judgments, which say which documents are relevant to each query and sometimes how relevant. The third is the ranked list the system returned. The metric scores each query, and the scores are averaged across queries. Most are computed at a cut-off k, written as @k, so only the top k results count.
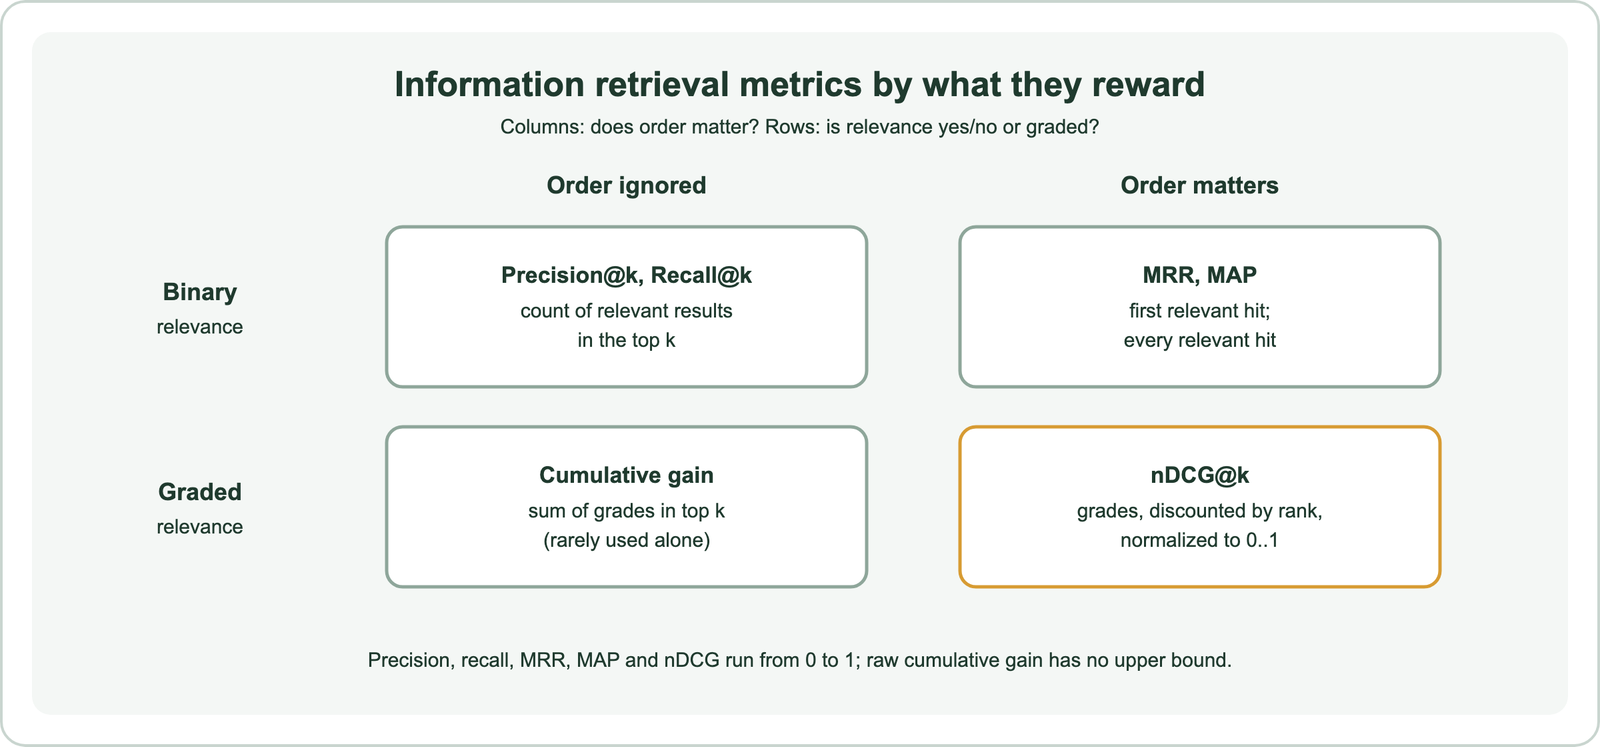
A Weaviate blog post on evaluation metrics sorts them the same way, into metrics that are not rank-aware, precision and recall, and rank-aware ones, MAP, MRR and nDCG. The practical consequence is that two systems can tie on precision at 10 and still differ a lot for users, because one puts the relevant results first. How to evaluate semantic search covers the full evaluation process.
These are offline metrics, computed from fixed judgments. A second family is measured on live traffic.
How do offline and online retrieval metrics differ?
Offline retrieval metrics score results against stored relevance judgments, while online metrics measure what real users do with results, such as clicking, reformulating or abandoning a search. Offline metrics are repeatable; online metrics show real behaviour.
Offline evaluation runs before release. The same queries and judgments score every candidate system, so a change in the score comes from the system, not from shifting traffic. Its weakness is that judgments are fixed: they may miss relevant documents nobody labelled, and they encode one person’s idea of relevance.
Online evaluation runs in production. Common signals include click-through rate, the share of searches with no results, the share of sessions abandoned without a click, and time to first click. They capture what users actually value but are noisy and biased by position, since people click top results more often whatever their quality. A/B tests compare systems on live traffic. Online search metrics and analytics covers these signals, and monitoring search quality in production covers tracking them over time.
Most teams use both: offline metrics to choose candidates quickly and safely, online metrics to confirm the winner helps real users. The offline metrics start with the simplest pair.
What do precision at k and recall at k measure?
Precision at k measures the share of the top k results that are relevant, and recall at k measures the share of all relevant documents that appear in the top k. Precision penalises noise in the results; recall penalises missing documents.
The formulas are short. Precision at k is the number of relevant results in the top k divided by k. Recall at k is the number of relevant results in the top k divided by the total number of relevant documents for that query. In Weaviate’s pastry example, the query “sweet pastry” has three relevant items, donut, muffin and scone. A system returns donut, bagel, muffin and croissant, so precision at 4 is 2 divided by 4, or 0.5, and recall at 4 is 2 divided by 3, or 0.667.
The two pull against each other as k changes. Raising k usually raises recall, since more relevant documents fit in, and lowers precision, since more irrelevant ones do too. Neither looks at order: a relevant document at rank 1 and one at rank 4 count the same. Precision at k and recall at k cover each in depth, and relevance vs recall explains why a system can retrieve everything and still feel irrelevant.
Recall at k has a special role in retrieval-augmented generation. If a prompt holds five passages, recall at 5 says whether the evidence reached the model at all. Order inside those five matters less. For ranked pages, order matters more.
How do MRR and MAP account for ranking order?
MRR accounts for ranking order by scoring only the position of the first relevant result, while MAP accounts for it by averaging precision at the rank of every relevant result. MRR fits tasks with one right answer; MAP fits tasks where every relevant result matters.
Reciprocal rank for one query is 1 divided by the rank of the first relevant result: 1 if it is first, 0.5 if second, 0.333 if third, and 0 if none appears. Mean reciprocal rank averages that over queries. It suits question answering, navigational search and known-item lookup, where the user stops at the first good result. Mean reciprocal rank covers it with worked tables.
Average precision takes the precision at each rank where a relevant document appears and averages them. The standard trec_eval definition divides by the total number of relevant documents, so missing documents count as zero. In the pastry example, precision is 1.0 at rank 1, where donut sits, and 0.667 at rank 3, where muffin sits. The sum, 1.667, divided by the three relevant items gives 0.556. Mean average precision averages that across queries. Weaviate’s article notes that MAP is most popular for recommendation systems.
Both metrics treat relevance as yes or no. When some results are better than others, a graded metric is needed.
How does nDCG handle graded relevance?
nDCG handles graded relevance by adding up each result’s relevance grade, discounted by the logarithm of its rank, and dividing by the best possible score for that query. The result runs from 0 to 1 and rewards putting the most relevant documents first.
Discounted cumulative gain at k sums, for each of the top k results, its grade divided by log base 2 of its rank plus 1. A grade-2 document at rank 1 adds 2; the same document at rank 3 adds 1. The ideal DCG is the same sum for the perfect ordering of the judged documents. Dividing one by the other normalizes the score, so queries with many relevant documents and queries with few become comparable.
With binary grades, nDCG still rewards early hits. In the pastry example, donut at rank 1 adds 1 and muffin at rank 3 adds 0.5, for a DCG of 1.5. The ideal ordering puts all three relevant items in the top three, for 2.131. The ratio is 0.704. Weaviate’s article runs a graded version, “goes well with jam”, with grades of 2 and 1, and reports an nDCG at 4 of 0.467 from pytrec_eval.
nDCG at 10 is the main score in many public benchmarks. Weaviate’s article notes it is the default for the MTEB leaderboard’s retrieval category, and the BEIR benchmark reports it too. nDCG covers variants and pitfalls. Seeing all five metrics on one list makes the differences concrete.
How do the metrics compare on one ranked list?
The metrics compare on one ranked list by scoring the same results very differently, because each rewards a different property. The pastry example shows a perfect first hit, half-relevant results and one missing item, and each metric reacts to a different part.
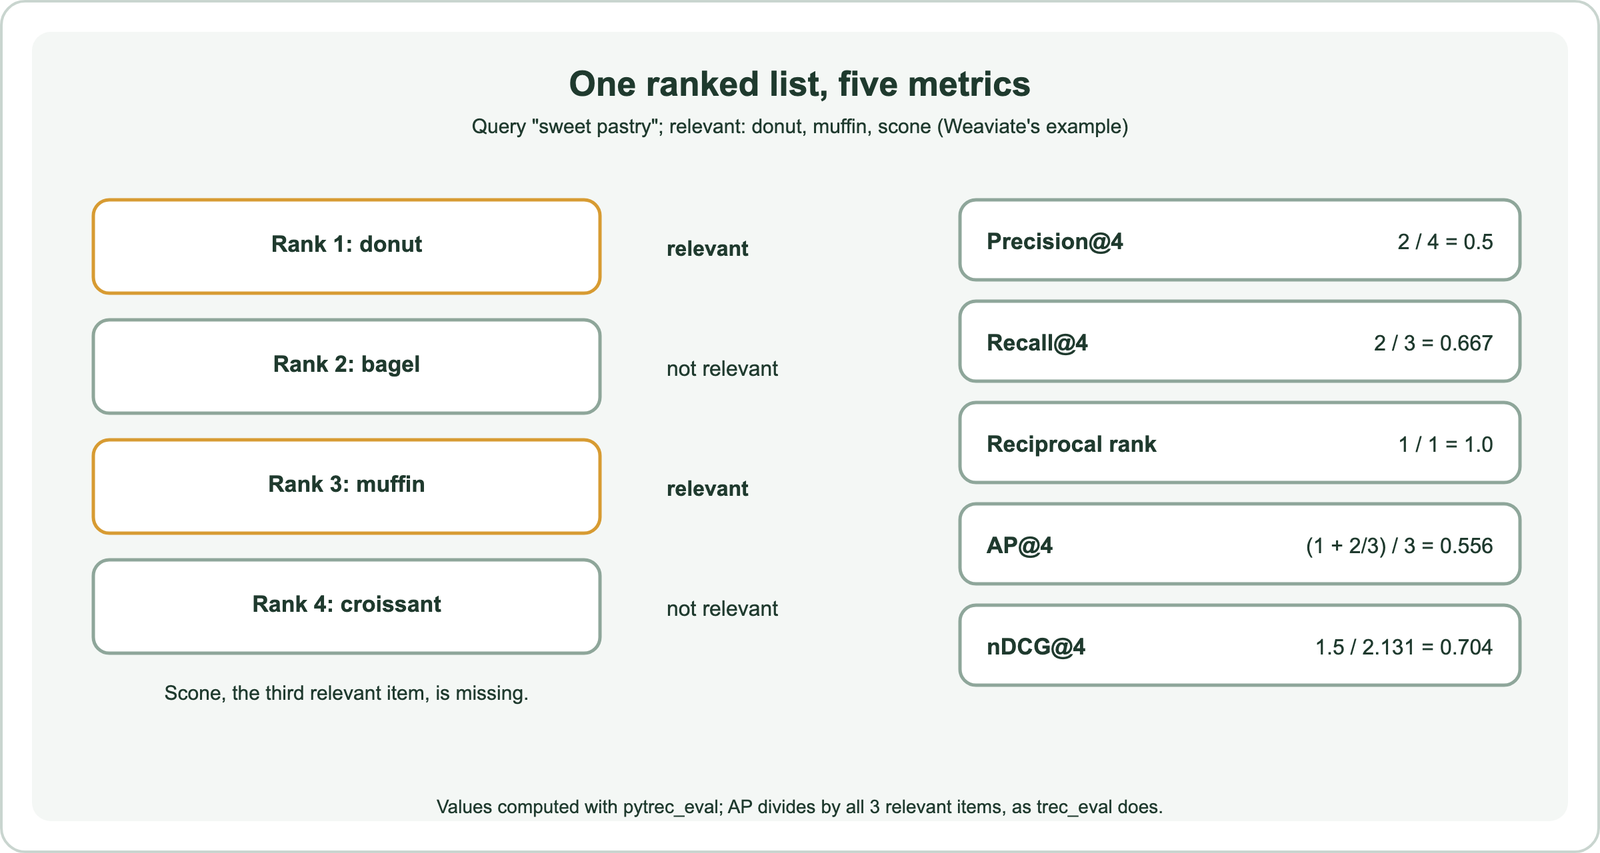
Reciprocal rank is perfect, 1.0, because the first result is relevant; it ignores the rest. Precision at 4 is 0.5, because half the list is noise. Recall at 4 is 0.667, because scone is missing. Average precision, 0.556, is lowest because it penalises both the gap at rank 2 and the missing item. nDCG, 0.704, sits between them, crediting the early hit and discounting the late one.
The lesson is that a single number hides trade-offs. A change that moves a relevant result from rank 3 to rank 2 raises AP and nDCG but leaves precision, recall and reciprocal rank unchanged. Reporting two or three metrics that match the use case catches more than any one. One more metric shares a name with recall but measures something else.
How is ANN recall different from retrieval recall?
ANN recall measures how many of the true nearest neighbours, found by exact search, an approximate index returns, while retrieval recall measures how many relevant documents a search returns. The first tests the index; the second tests the whole system.
Weaviate’s article on RAG evaluation draws the same line. Vector index benchmarks report recall against brute-force nearest neighbours, alongside queries per second. That is a statement about the index’s approximation error, not about relevance. An index can reach perfect ANN recall and still return irrelevant documents if the embedding model ranks them close to the query.
The two connect. Lower ANN recall drops some true neighbours, which can drop relevant documents and lower retrieval recall. Whether it does depends on how many of the dropped neighbours were relevant. Measure retrieval quality at the index settings you plan to run. ANN recall covers the index side and its parameters. With the metrics defined, the choice comes down to the task.
Which retrieval metric should you use?
The retrieval metric you should use is the one that matches how results are consumed. That means recall at k for RAG, MRR or success at 1 for single-answer search, nDCG at 10 for ranked result pages, and MAP for recommendation-style lists. Report one primary metric and one or two supporting ones.
| Use case | Primary metric | Why |
|---|---|---|
| RAG context retrieval | Recall@k, k = passages in the prompt | The model can only use evidence that reaches the prompt |
| Question answering, known-item search | MRR or success@1 | Users stop at the first good result |
| Ranked search result pages | nDCG@10 | Order and grades both matter |
| Recommendations | MAP@k | Every relevant item in the list counts |
| Approximate index tuning | ANN recall@k | Isolates index error from relevance |
The table is a starting point. Success at k, also called hit rate or top-k accuracy, is 1 if any relevant result appears in the top k and 0 otherwise. Top-5 accuracy, borrowed from classification, is the same as success at 5. Weaviate’s Search Mode benchmark reports success at 1, recall at 5 and nDCG side by side, a common combination.
Whatever the metric, it is only as good as the judgments behind it.
What data do retrieval metrics need?
Retrieval metrics need a set of representative queries and relevance judgments for each one, collected from human labels, user behaviour or public benchmarks. The judgments define what “relevant” means, so their quality caps the metric’s meaning.
Public benchmarks such as BEIR and MTEB provide queries and labels across many domains. They are useful for comparing models but rarely match a specific product’s data. A custom test set fits better. Weaviate’s academy course on custom benchmarks suggests starting small but representative, and notes that even 20 objects with multiple queries can yield meaningful results. Search test sets and relevance judgments covers building one, and retrieval benchmarks covers the public options.
Labels can come from domain experts, from click logs as weak supervision, or from language models prompted to judge relevance. Each has bias. Unlabelled relevant documents are a common trap: a new system that finds them scores as if it retrieved junk. Review a sample of “irrelevant” top results by hand before trusting a drop. Why vector search returns irrelevant results covers diagnosing the misses themselves.
Computing the scores is the easy part once the data exists.
How do you compute information retrieval metrics in Python?
You compute information retrieval metrics in Python with a library such as pytrec_eval, which takes relevance judgments and a run of scored results and returns each metric per query. It wraps trec_eval, the standard evaluation tool from the TREC conferences.
import pytrec_eval   # pip install pytrec_eval-terrier

qrel = {"sweet pastry": {"donut": 1, "muffin": 1, "scone": 1}}
run = {"sweet pastry": {"donut": 0.95, "bagel": 0.9, "muffin": 0.8, "croissant": 0.7}}

measures = {"P.4", "recall.4", "recip_rank", "map_cut.4", "ndcg_cut.4"}
evaluator = pytrec_eval.RelevanceEvaluator(qrel, measures)
for name, value in sorted(evaluator.evaluate(run)["sweet pastry"].items()):
    print(name, round(value, 3))
The run printed P_4 0.5, map_cut_4 0.556, ndcg_cut_4 0.704, recall_4 0.667 and recip_rank 1.0, matching the worked example. The qrel dictionary holds judgments, with grades as integers. The run holds the system’s scores; pytrec_eval sorts by score itself, so ties need care. For many queries, add more keys to both dictionaries and average the per-query results.
Sentence Transformers also includes an information retrieval evaluator for embedding models. Using one library across experiments keeps definitions consistent, which matters because MAP and nDCG have variants that give different numbers.
Information retrieval metrics turn search quality into numbers by comparing ranked results with relevance judgments. Precision and recall at k count relevant results in the top k, MRR rewards the first hit, MAP rewards every hit by position, and nDCG weighs graded relevance by rank. On one ranked list they can disagree widely, as the pastry example’s scores from 0.5 to 1.0 show. Choose the metric that matches how results are used: recall at k for RAG, MRR for single answers, nDCG at 10 for result pages. Build a representative test set, compute scores with a standard library, and confirm offline wins with online behaviour.